Process Chart
From Visuals Process Chart empowers you to visualize and analyze any process-related data with interactive features and highly customizable formatting options. Ideal for business analysts, operations managers, decision-makers, and anyone looking to gain insights from processes, this visual ensures that every detail is accessible and easy to understand.
Pricing
From Visuals Process Chart can be used free as individual usage, but if you want to use visual in published report, each user needs a named license that can be bought through AppSource.
$4.99
/user/month
Individual
Price per license
- Power BI Desktop
- Power BI Service
- Assign licenses per user or for small groups
- Buy only as many licenses as needed
Support
For any issues reach out to our support team Contact Us
Live demo
Try the Process Chart live here!
Use Cases
-
Workflows: Analyze workflow routings to identify bottlenecks and determine the most efficient paths.
-
Business Processes: Review business processes to uncover inefficiencies and discover best practices.
-
Application Usage: Evaluate user interactions with applications to optimize their experience and enhance performance.
And more! With From Visuals Process Chart, you can analyze any process-related data, making it a versatile tool for various applications.
Key Feature Highlights
-
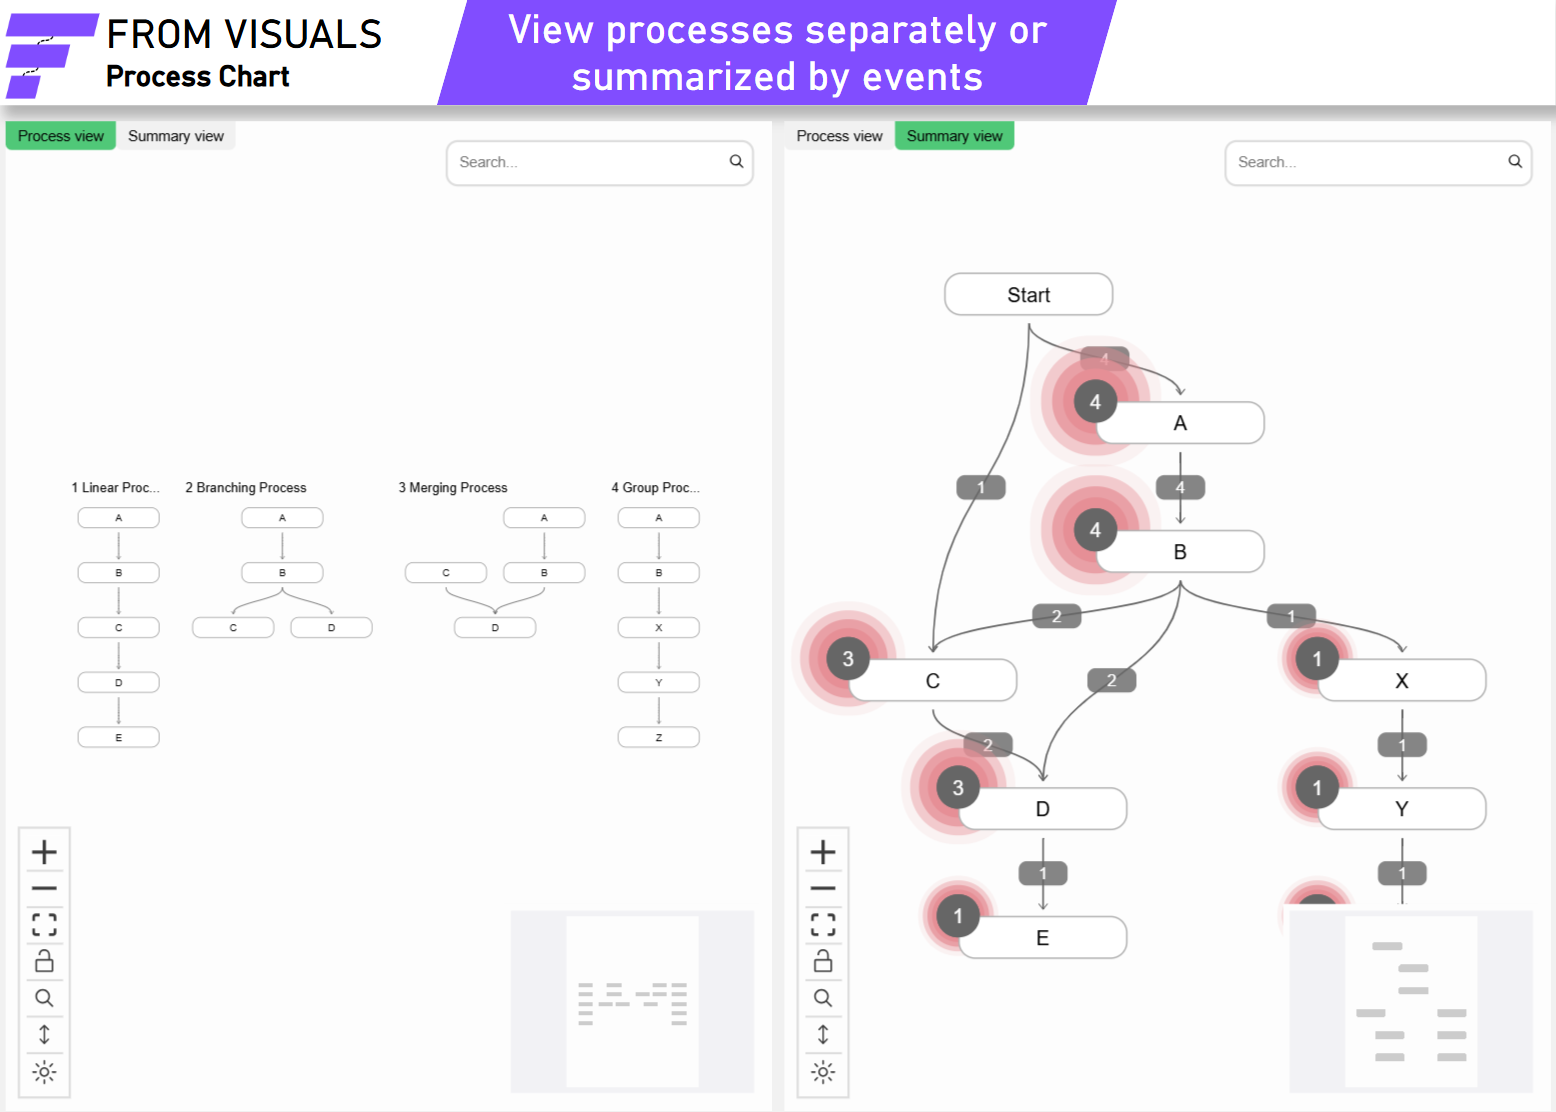
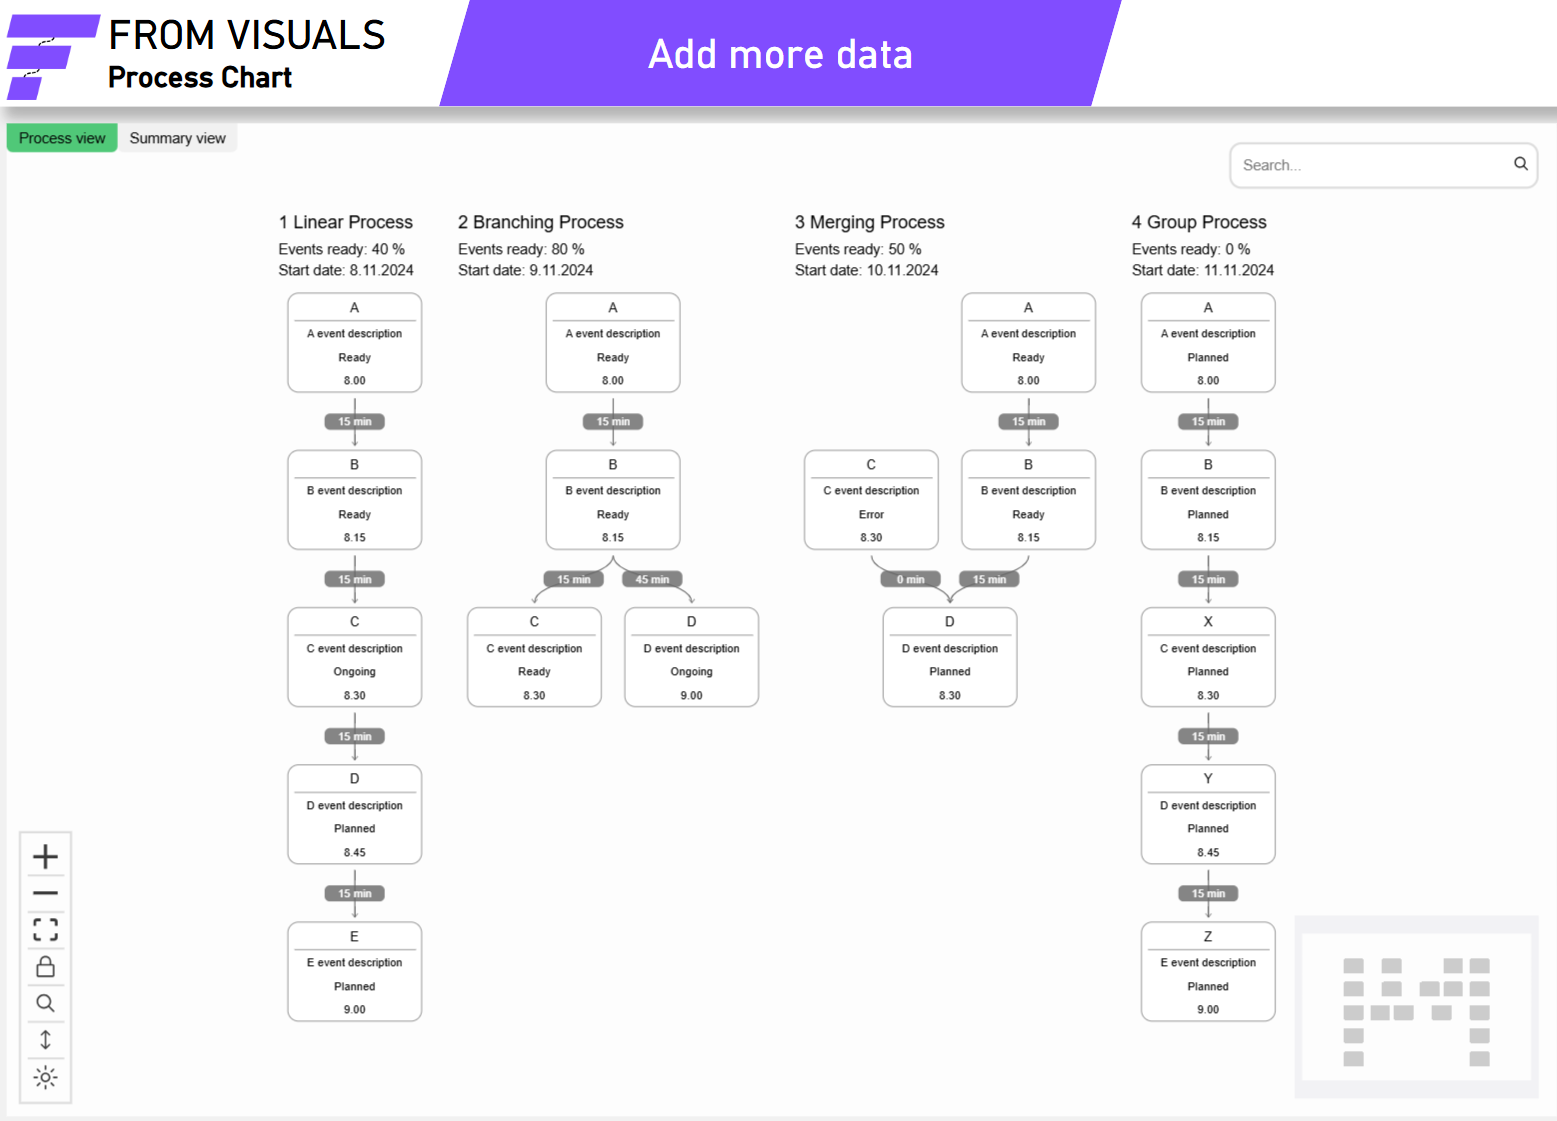
Two Views: Switch between detailed 'Process' view and broader 'Summary' view. The 'Process' view provides in-depth information on each unique process, while the 'Summary' view groups all processes, offering a wider perspective.
-
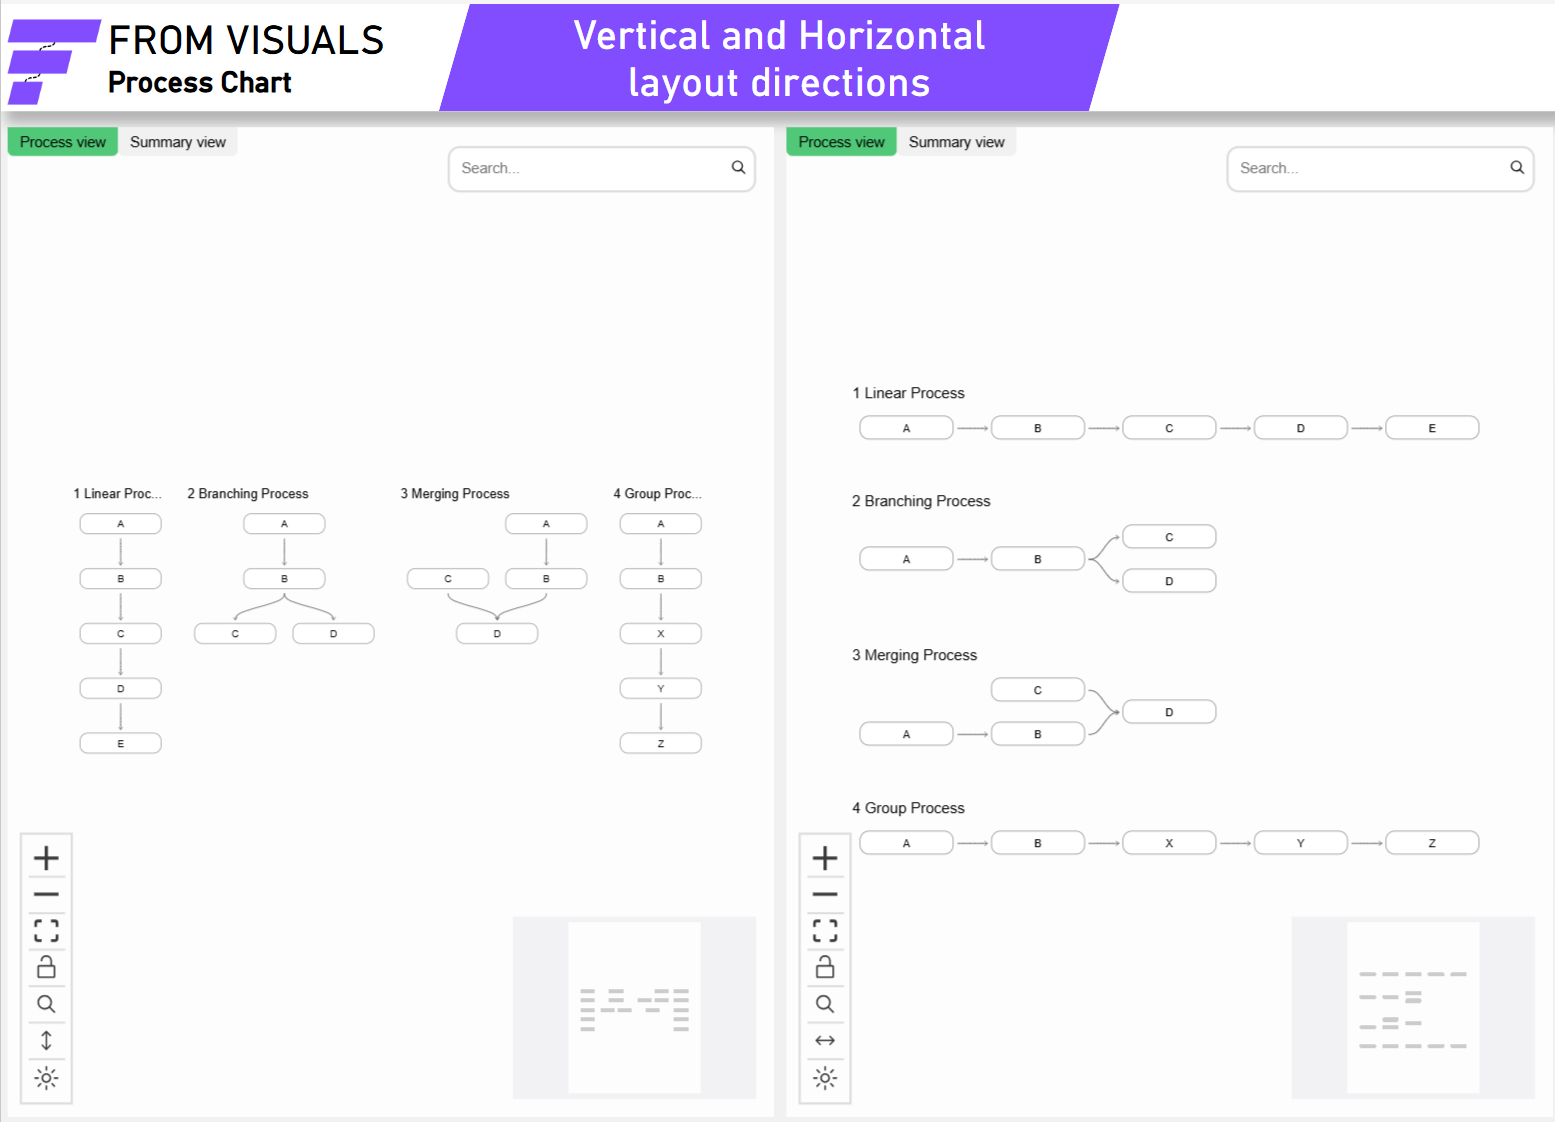
Layout Directions: Choose between horizontal and vertical layout directions to best fit your data and presentation style
-
Drill-Through: In addition to native Power BI drill-through, the Process Chart offers a built-in feature that lets you drill through from the Summary view to see related processes where exactly the specific events occur.
-
Event Groups: Organize and categorize events by grouping them into event groups.
-
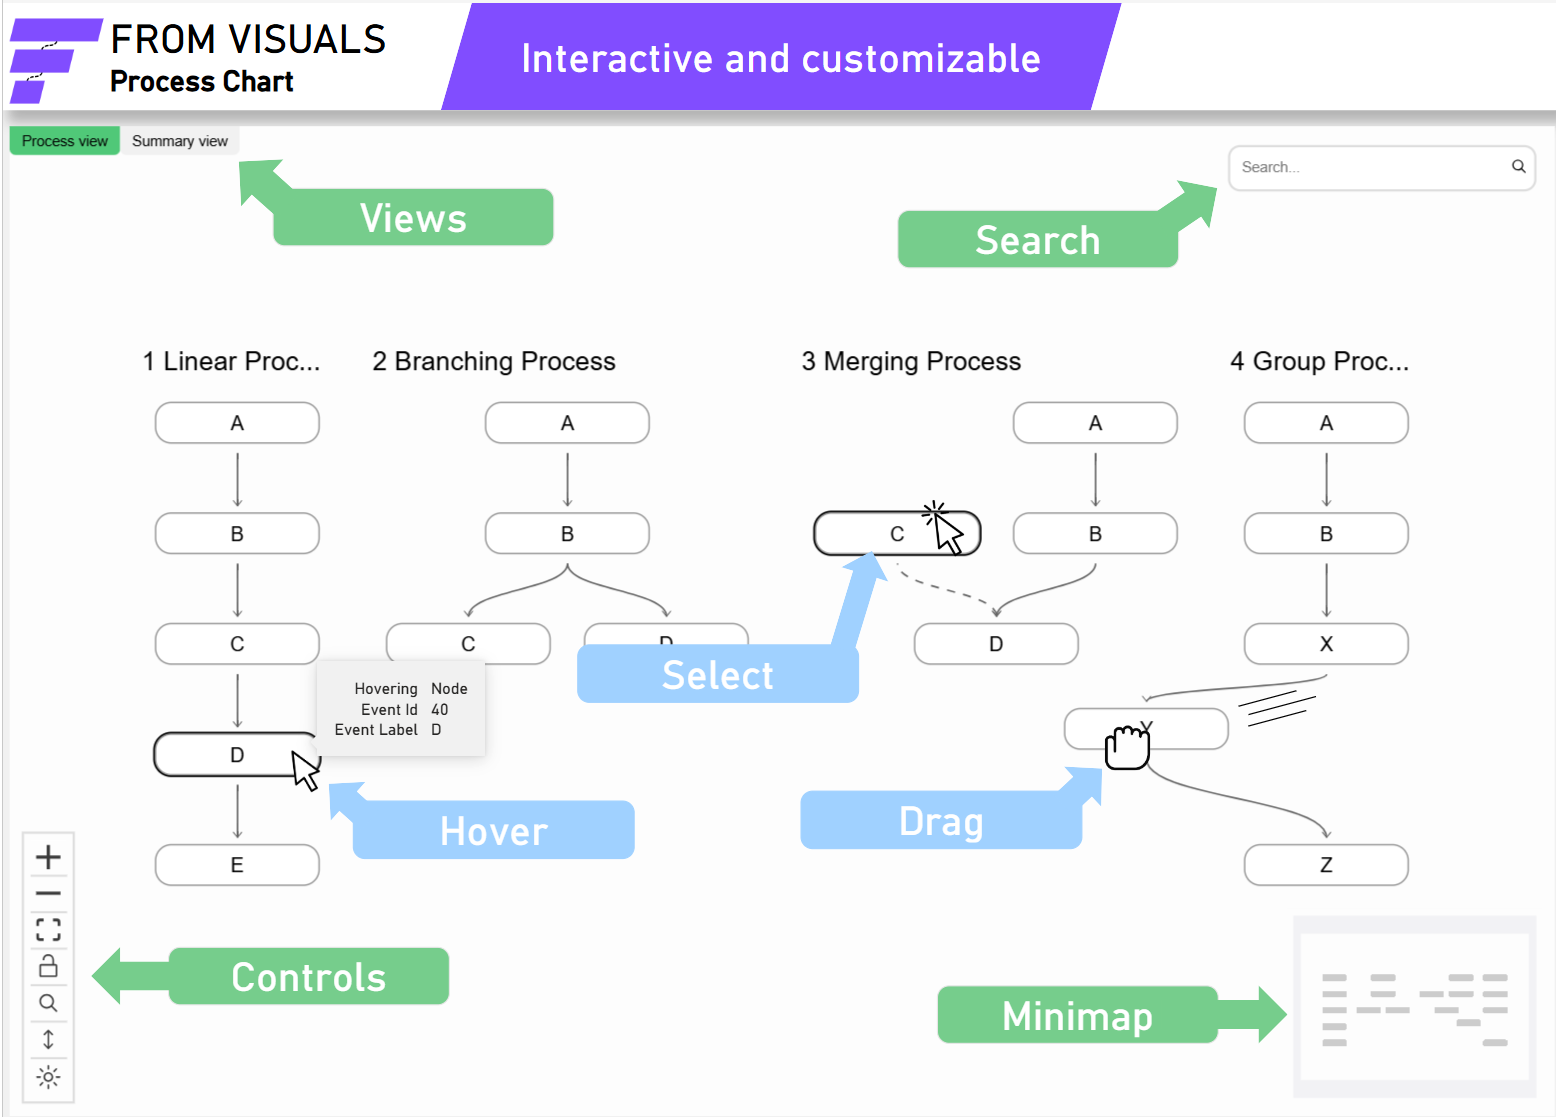
Interactive: A variety of out-of-the-box interactive features for efficient process analysis, including:
-
Zoom: In/out to focus on specific areas.
-
Fitview: Reset the viewport to center.
-
Minimap: Easily locate your position within a large canvas.
-
Tooltips: Use Power BI’s default tooltips or create custom ones, with the possibility to toggle it off on the fly, allowing you to present content without obstruction.
-
Search: Use the search bar to find specific processes and events. Once found, simply click, and you'll be navigated to it.
-
Animations: Selecting events or edges animates the paths to related ones.
-
Drag and Drop: Move events and whole processes by dragging.
-
Navigation: Drag the canvas or navigate by scrolling while holding Shift or Space.
-
Hyperlinks: Web URLs are supported and they appear as clickable links.
-
Copy to Clipboard: Easily copy values by simply hovering and clicking the appearing copy button.
-
-
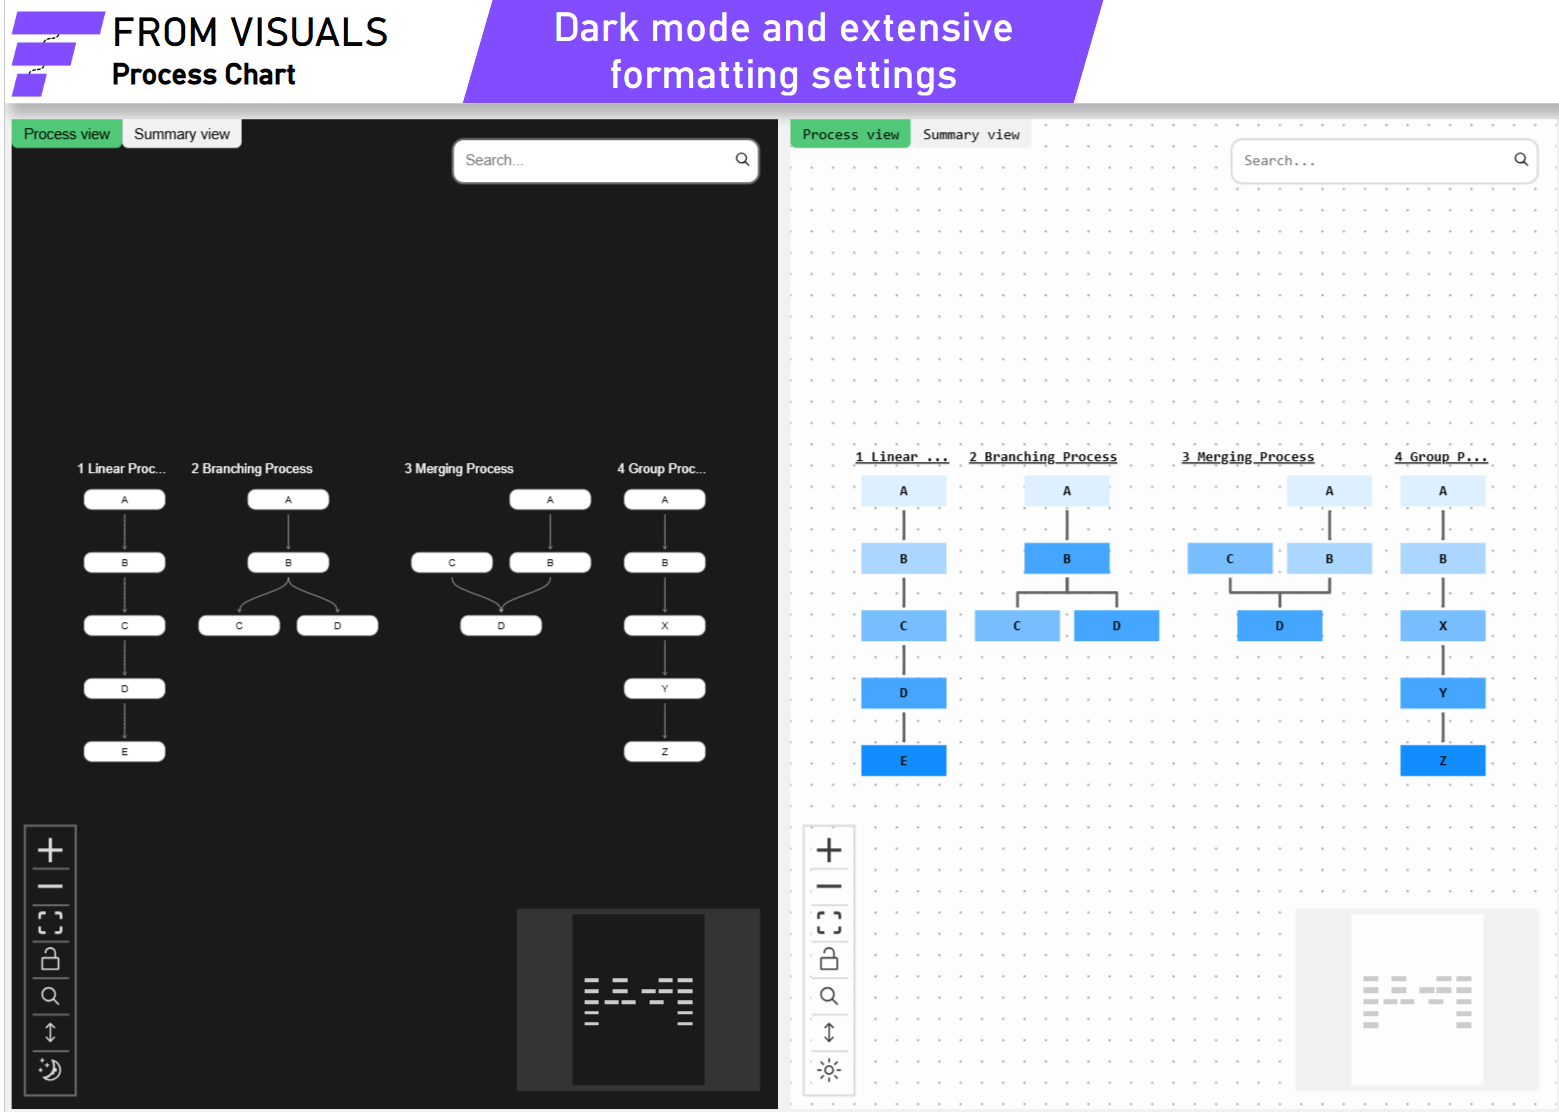
Formatting: Tailor the visual appearance to meet your preferences with:
-
Conditional Formatting: Format events according to the rules you define, based on your data.
-
Extensive Formatting Options: Personalize your visual with a wide range of formatting options.
-
Dark Mode: Supports both dark and light themes for a visually appealing experience.
-
How it looks
