Views / Tabs
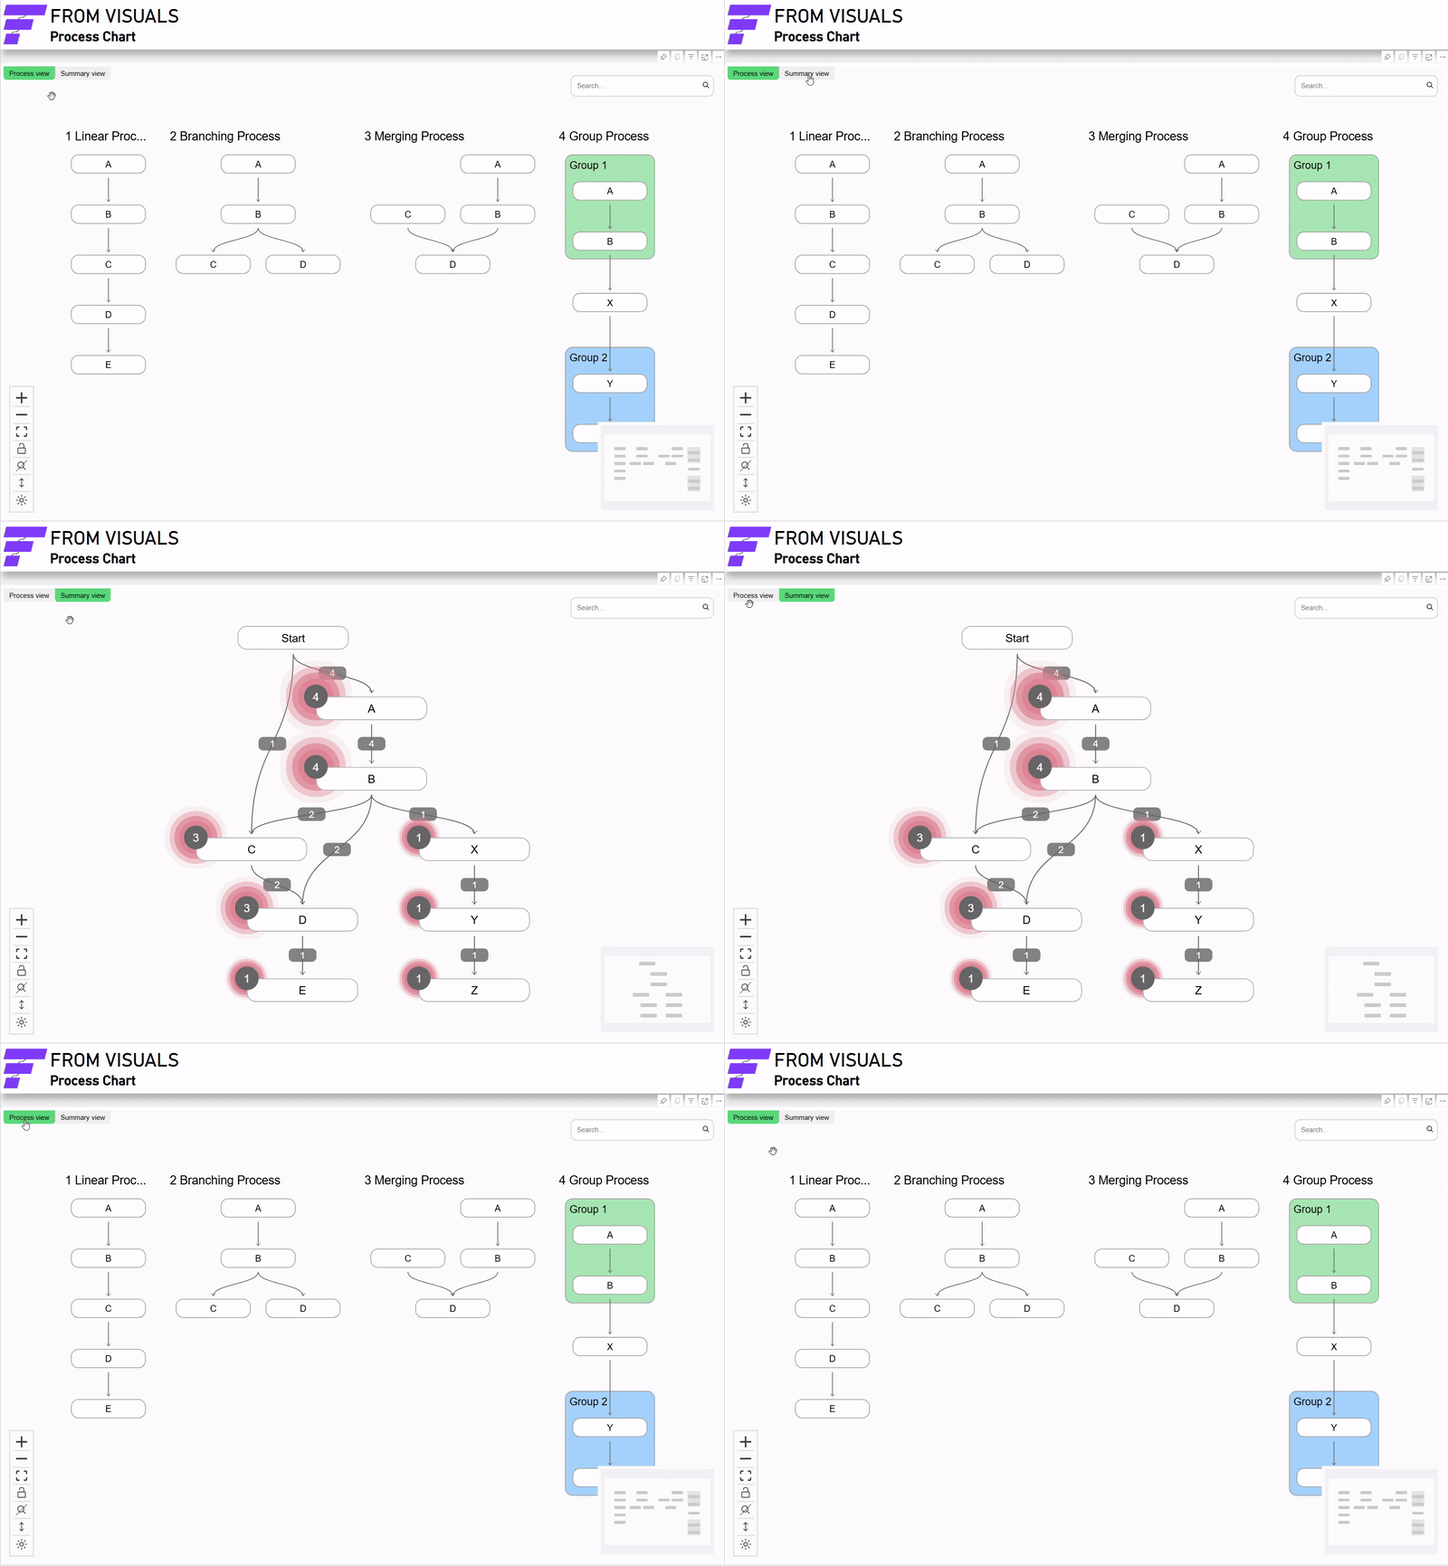
Process Chart has two views, Process and Summary. The "Process" view shows each process as unique, while the "Summary" view summarizes similar events across multiple processes.

Understand Summary View
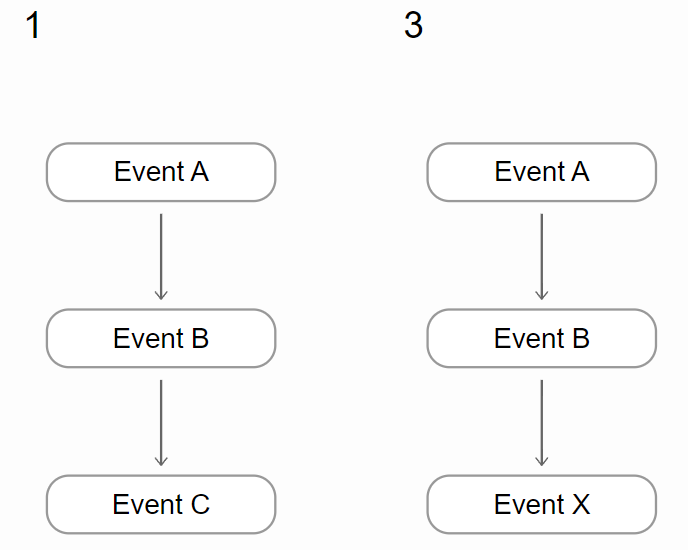
Summarization can be described with the following example. Let's consider these two simple process:

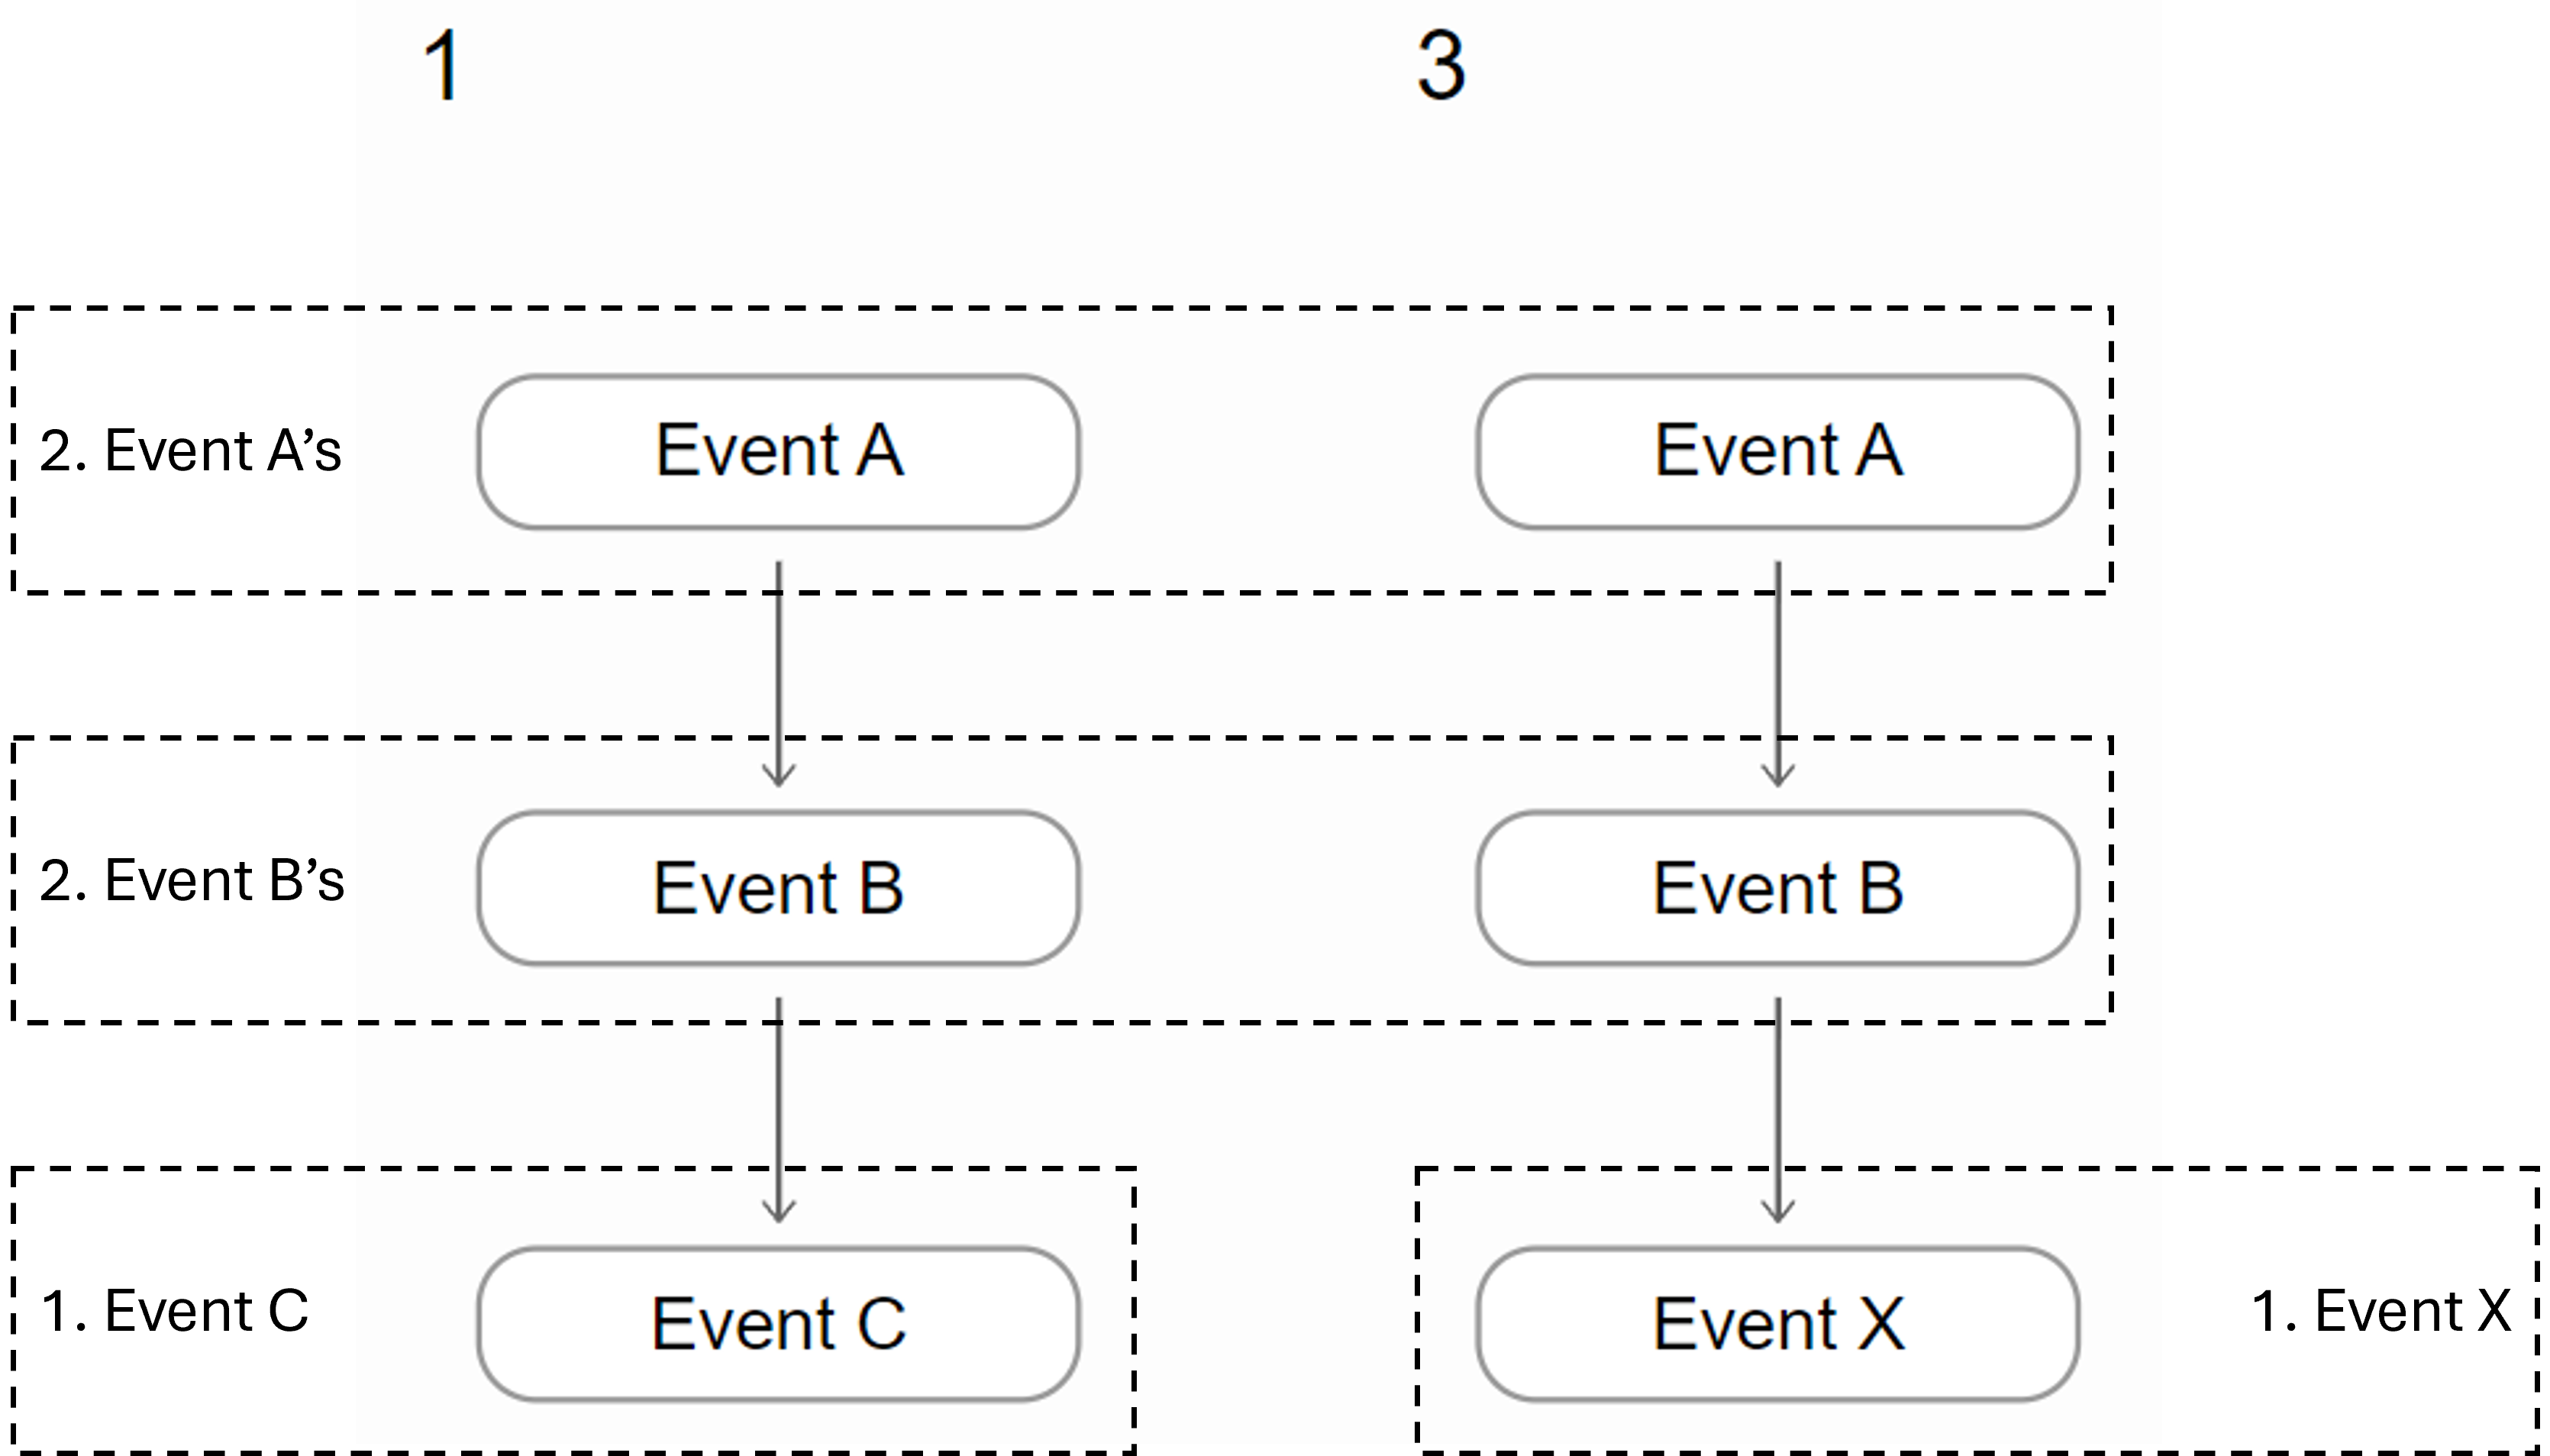
Summarization works so that similar events are counted:

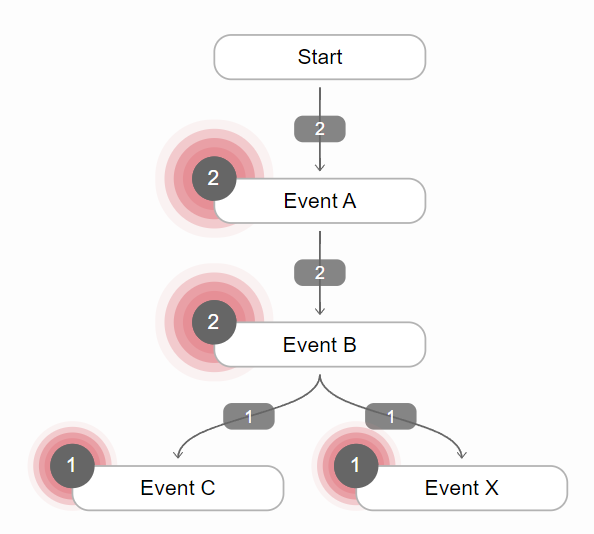
and Summary view shows each event as one node with count label:

Also edges are counted. There are two similar Event A -> B edges but only one of both Event B -> C and Event B -> X.
Summary view has also additional node "Start". Nodes that are connected to Start-node are one's starting the processes. Edges from Start-node shows how many of the related event's are first in processes. In this example both processes start from Event A, so count is 2.