Data Summarization
This section of the documentation explains how Power BI summarizes data for the Process Chart.
When considering summarization, data fields can be divided into grouping and measures. Grouping represents the hierarchy of the data, while measures are values assigned to specific levels within that hierarchy.
Data Fields
| Data Field | Summarization |
|---|---|
| Process Id | Grouping |
| Process Label | Measure |
| Additional Process Labels | Measure |
| Event Id | Grouping |
| Next Event Id | Grouping |
| Event Label | Measure |
| Additional Event Labels | Measure |
| Event Group | Measure |
| Edge Labels | Measure |
Grouping Hierarchy
The hierarchy of the three grouping data fields is as follows:
- Process Id
- Event Id
- Next Event Id
- Event Id
Conclusion:
- Process Id: This is the top-level grouping, representing the unique id for a process.
- Event Id: This is the second level, identifying specific events within a process.
- Next Event Id: This is the third level, representing the egdes to other events within a process.
Data Example
Summarization works exactly the same way as in the Power BI Matrix Table, making it a good way to present a simple example.
Process Id level
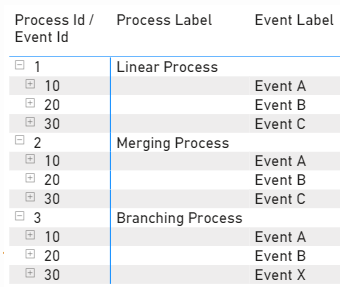
Let's start by adding only the Process Id. This level identifies each process.
Measures mapped to this level:
- Process Label
- Additional Process Labels
Event Id level
Next, let's expand the Matrix to the Event Id. This level identifies each event within the process.

Measures mapped to this level:
- Event Label
- Additional Event Labels
- Event Group
Next Event Id level
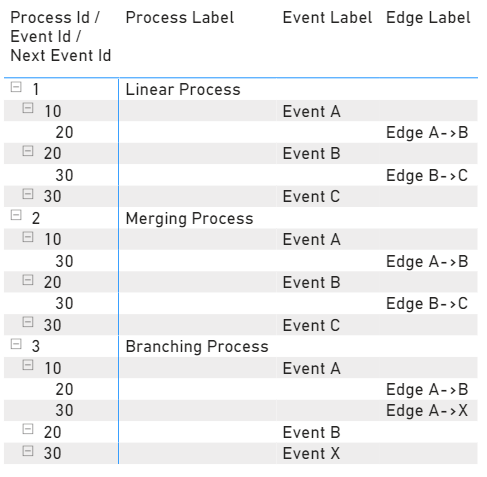
And finally, the last level: Next Event Id. This level identifies each edge from the event.

Measures mapped to this level:
- Edge Labels
Same data can be seen in Process Chart like this:

Conclusion
When planning data modeling for the From Visuals Process Chart, you can approach it similarly to how Rows and Values are structured in a Power BI Matrix Table.