Data Modeling
The best practice for data modeling is to align it with how From Visual Process Chart Data Summarization works.
Let's walk through a simple example where 'Processes' are in one table and 'Events' are in another.
Process Level
Here's the process data, which contains only 4 rows—representing 4 separate processes. Each process has a unique identifier: 'Drive Id' (primary key).

Event Level
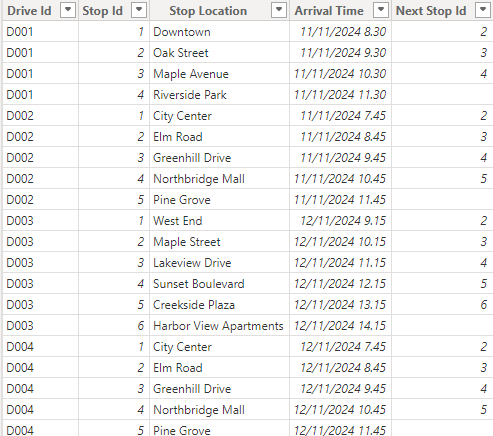
And here's the event data, which has a few more rows. Each row includes a 'Drive Id' (foreign key) that indicates which process the event belongs to.

Data Model
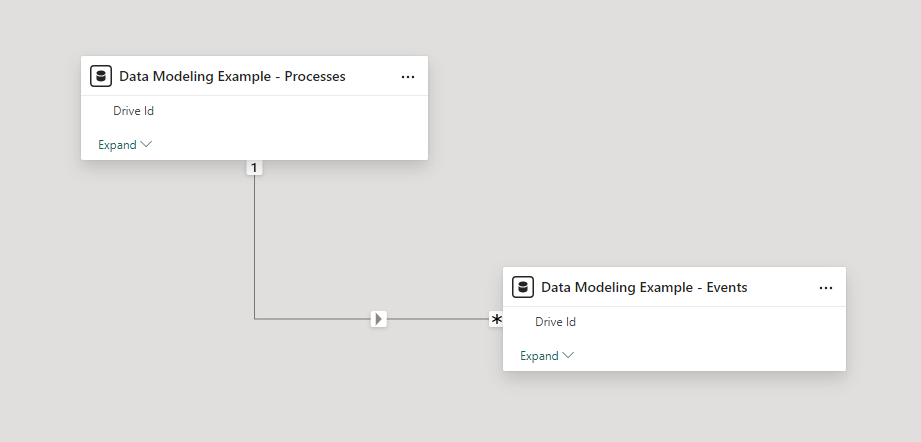
In Power BI, we can create a relationship between these tables using the 'Drive Id'.

Report View
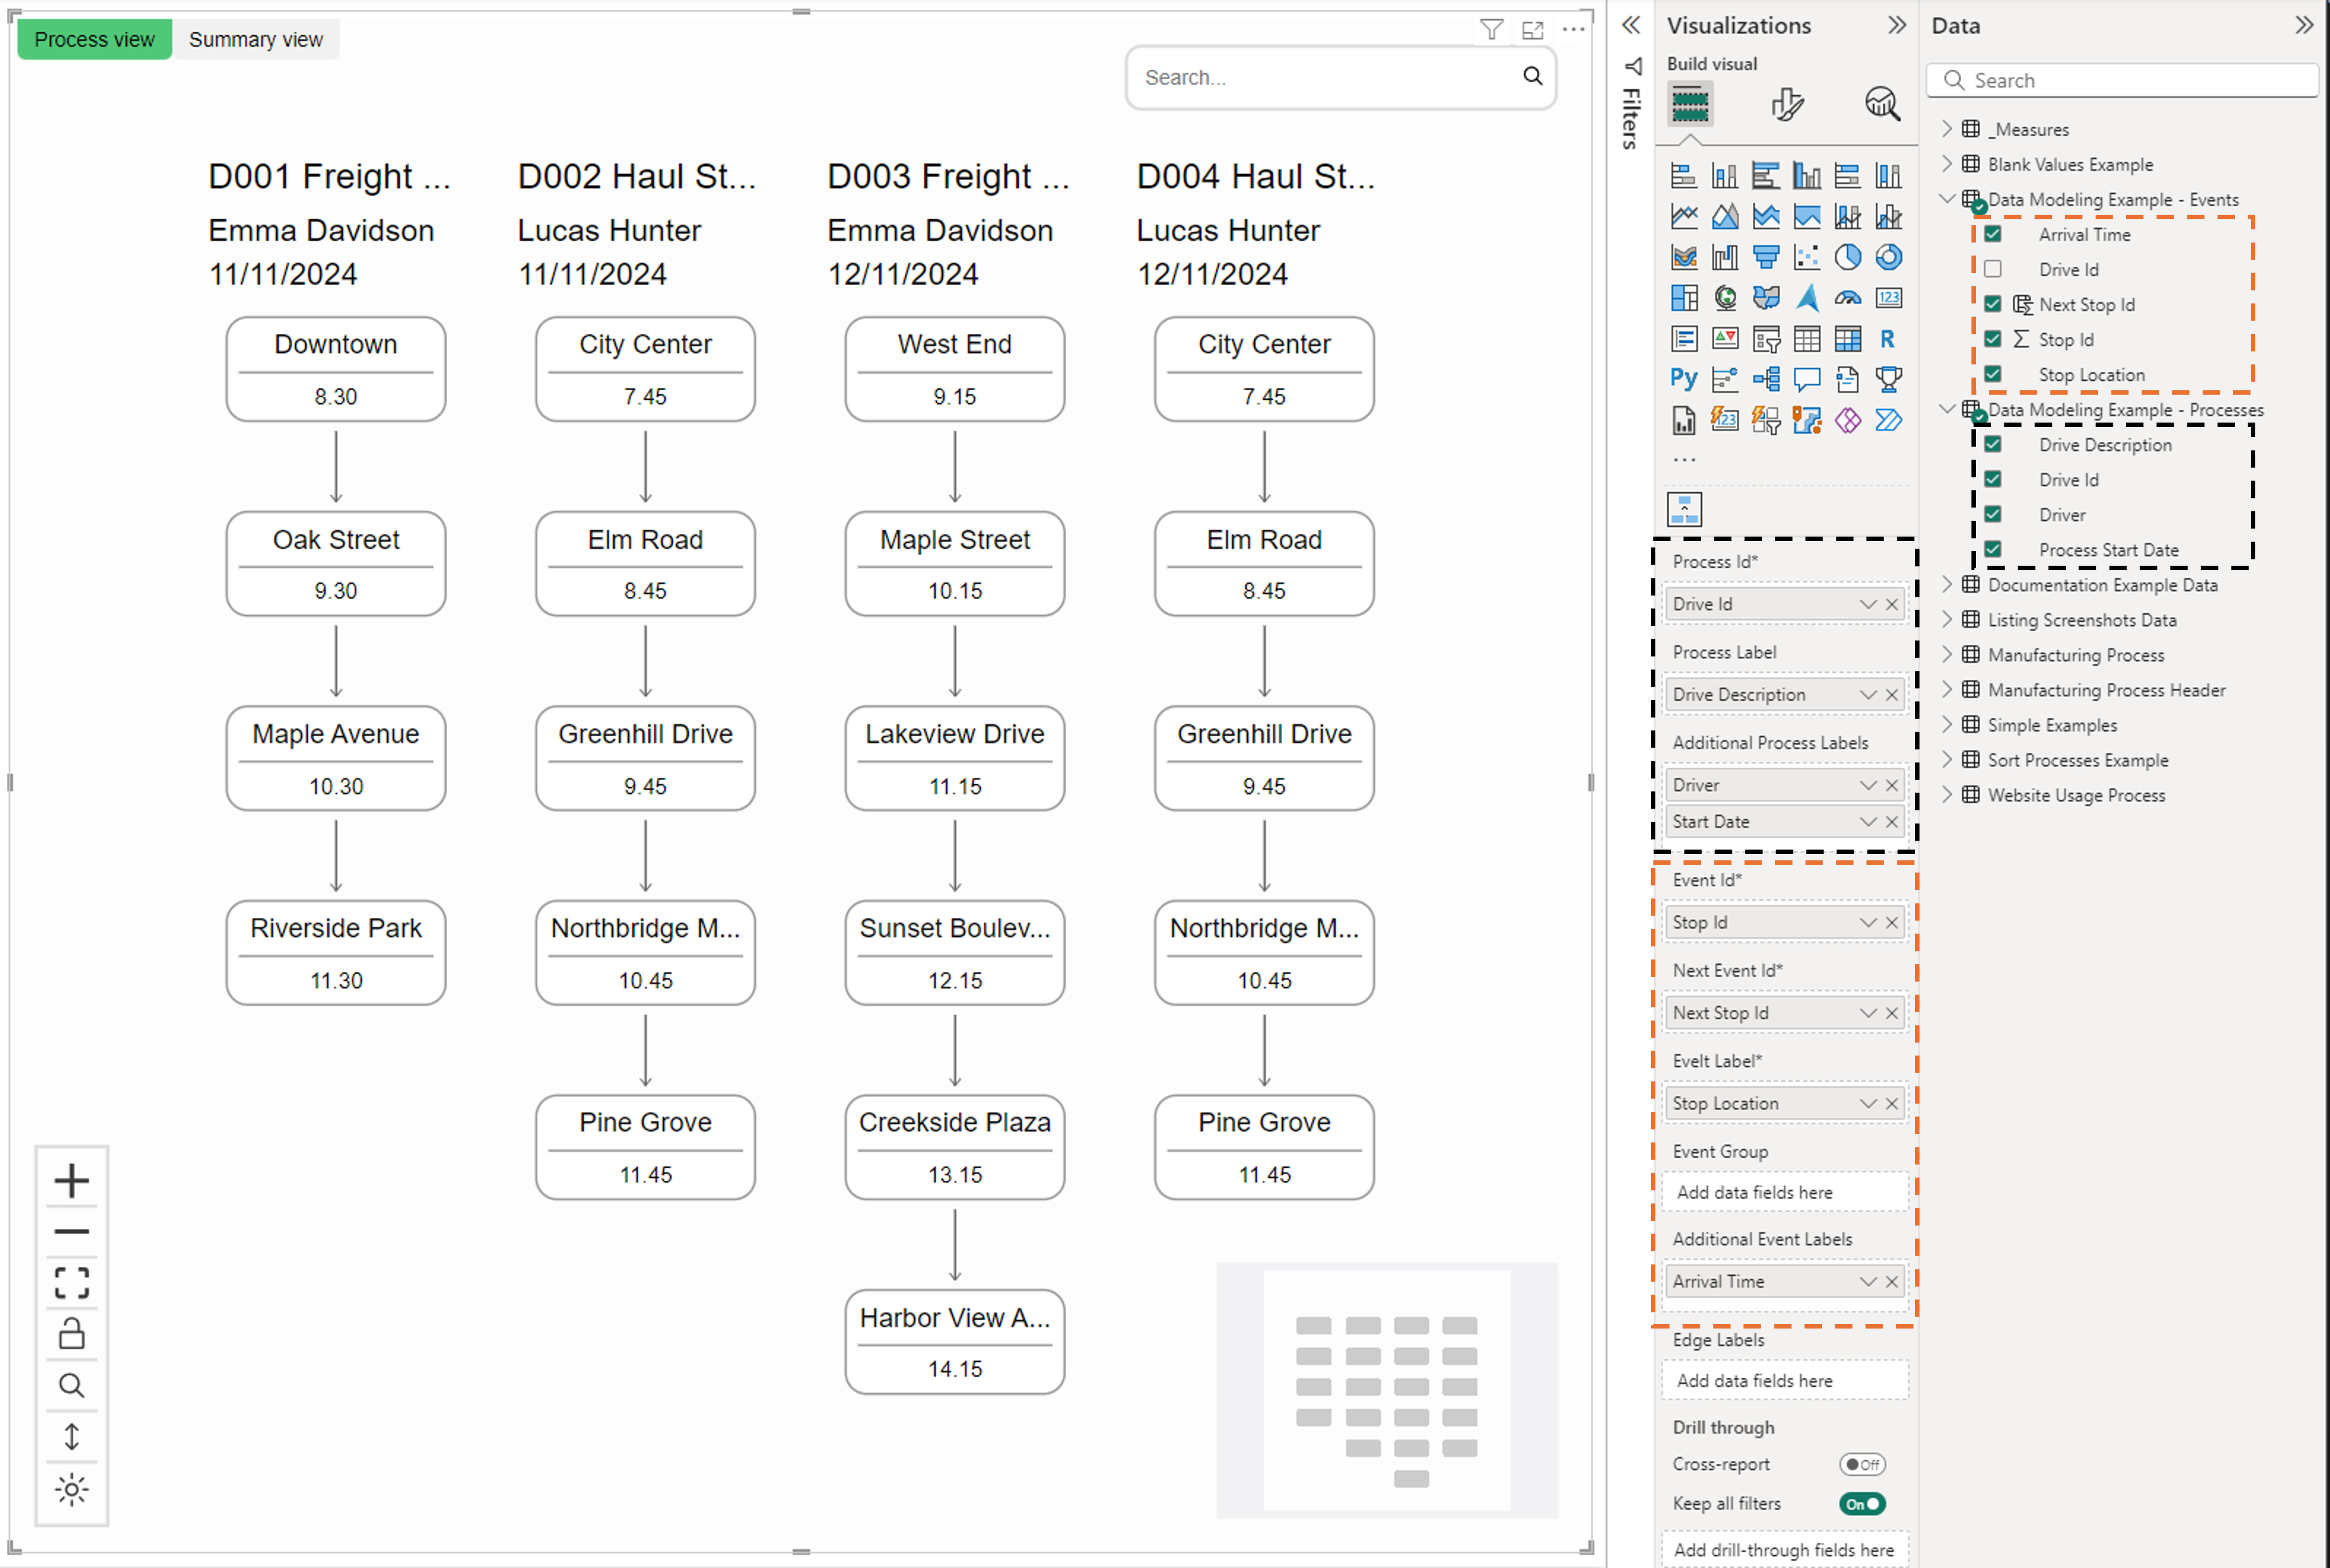
Now we can use fields from both tables.
