Conditional Formatting
Conditional formatting can be set to:
- Nodes background color
- Nodes border color
Set conditional formatting
It can be set like in any native visualization in Power BI from the formatting options.
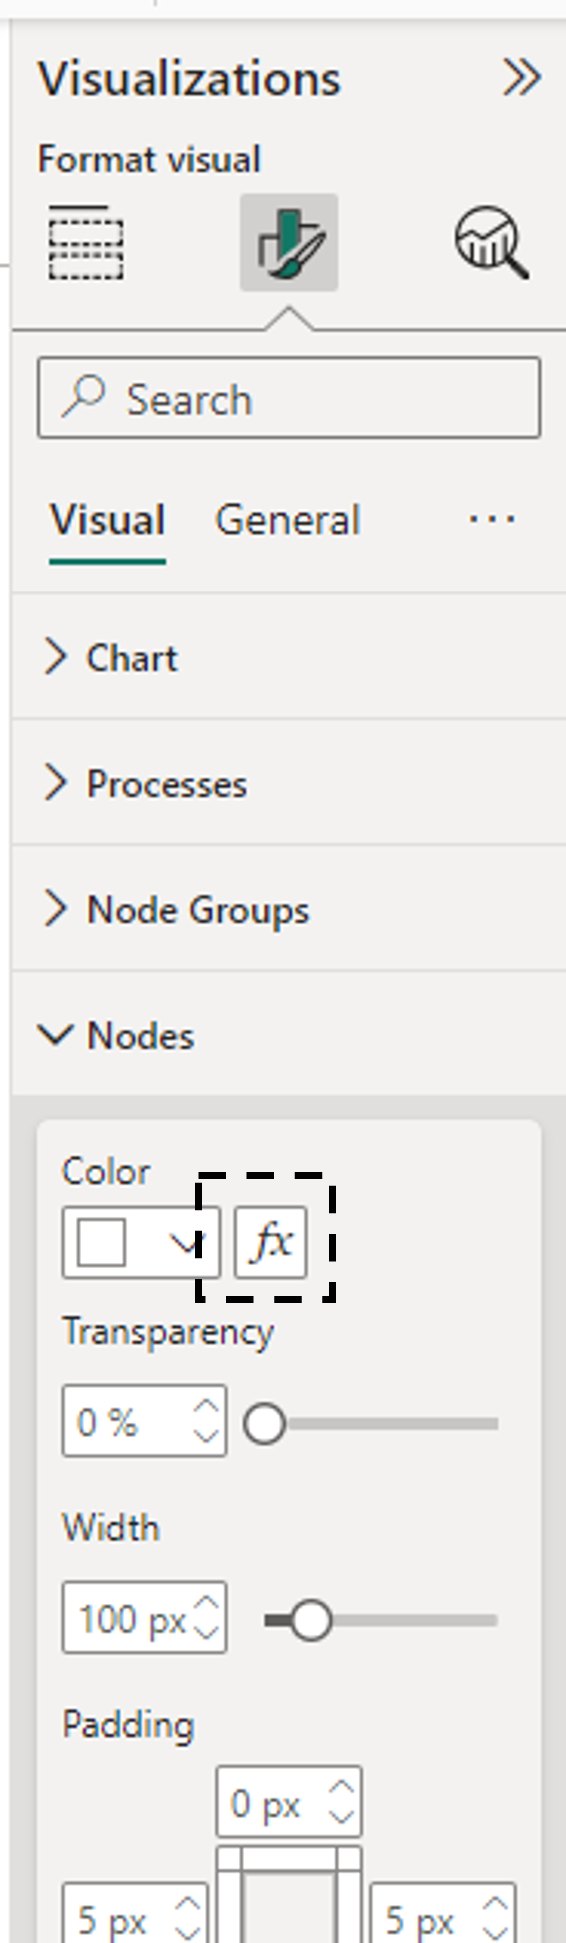
1. Open Visualizations Formatting Options and select Nodes -> Color
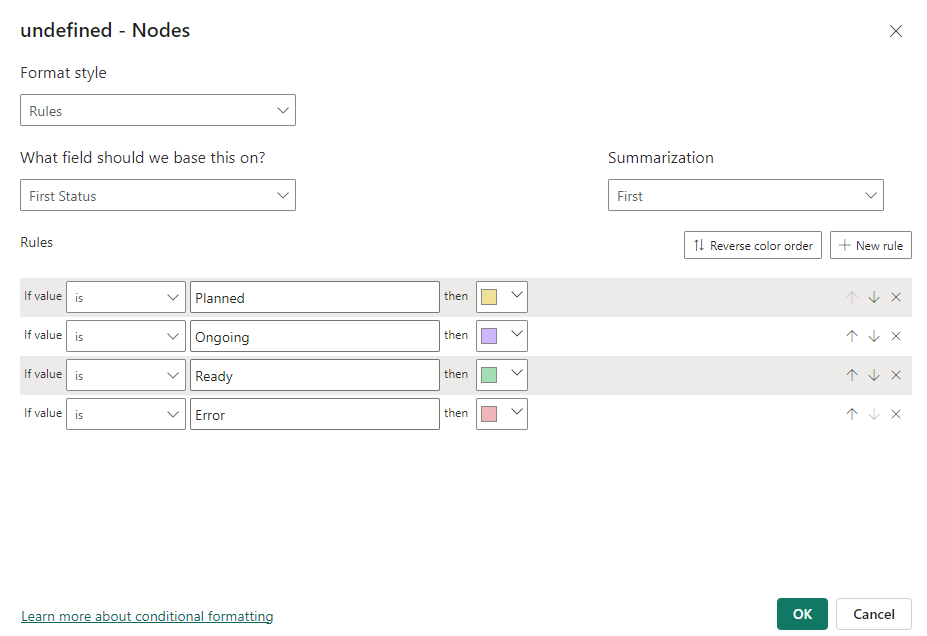
2. Define rules in the same way as for any default Power BI visual
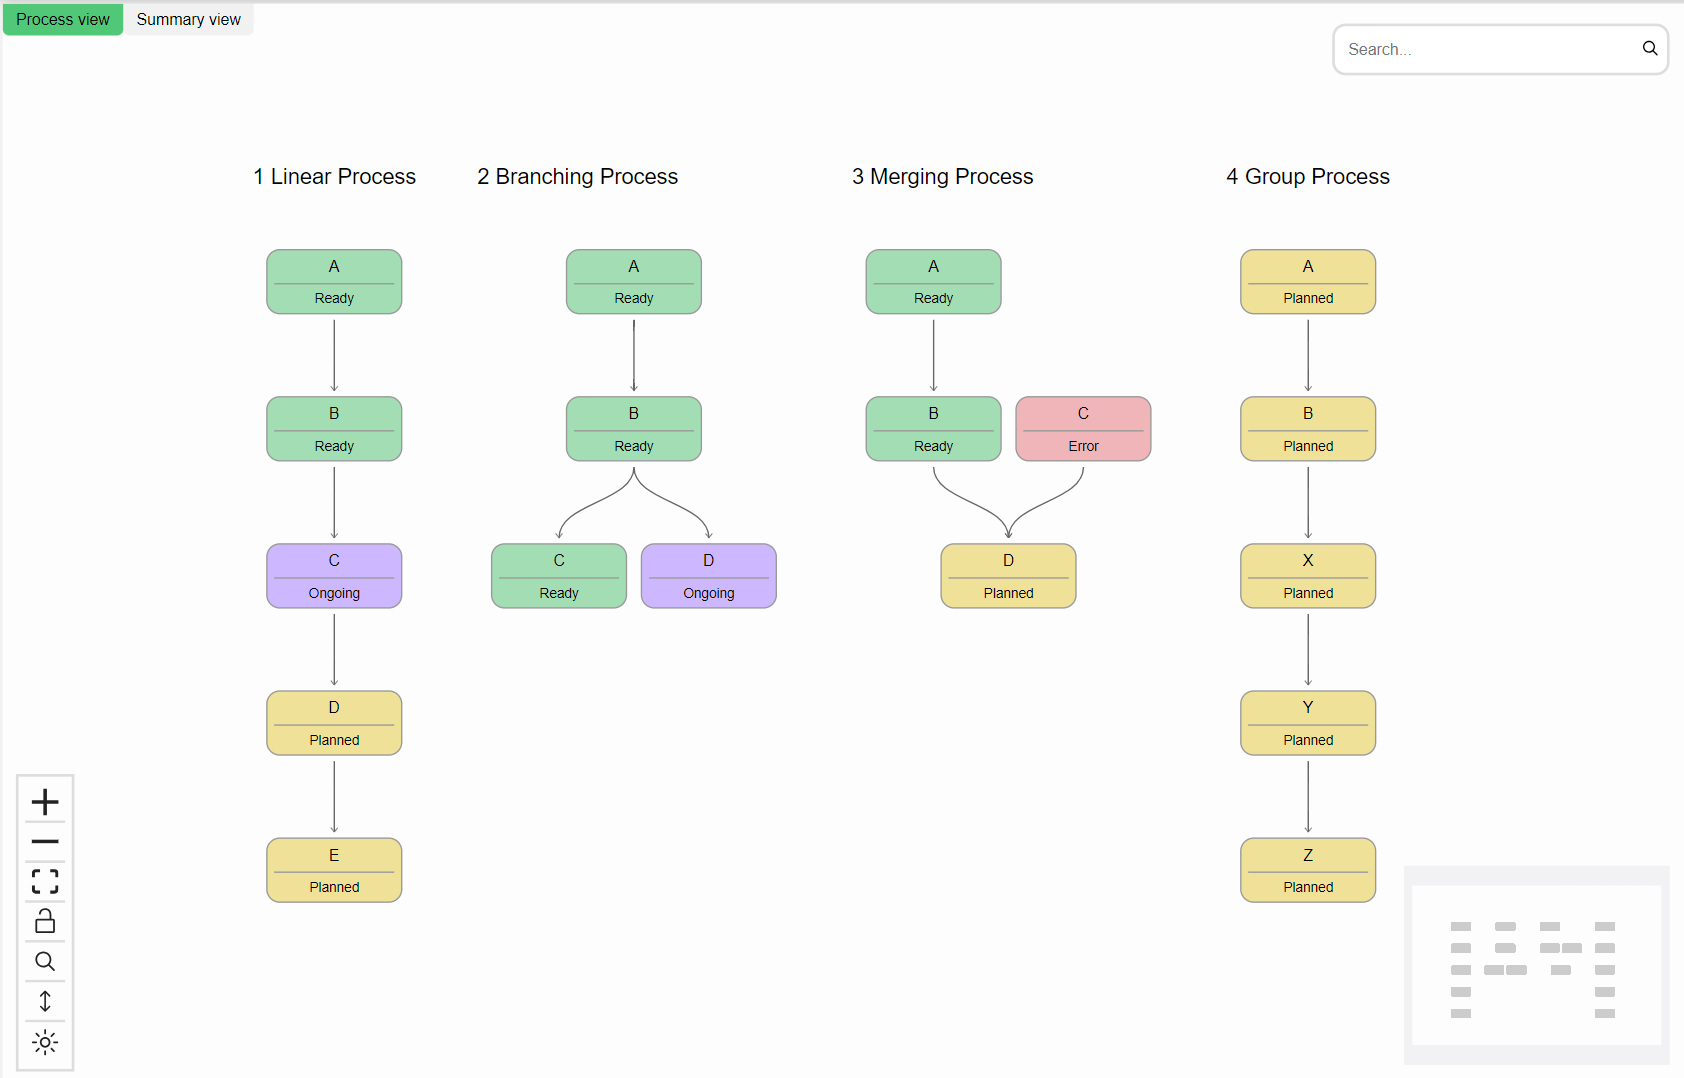
3. Voila! Node colors now reflect the status of the events.
TIP
You can also use any other format styles available in Power BI:

See more from Apply conditional formatting in Power BI - Power BI | Microsoft Learn