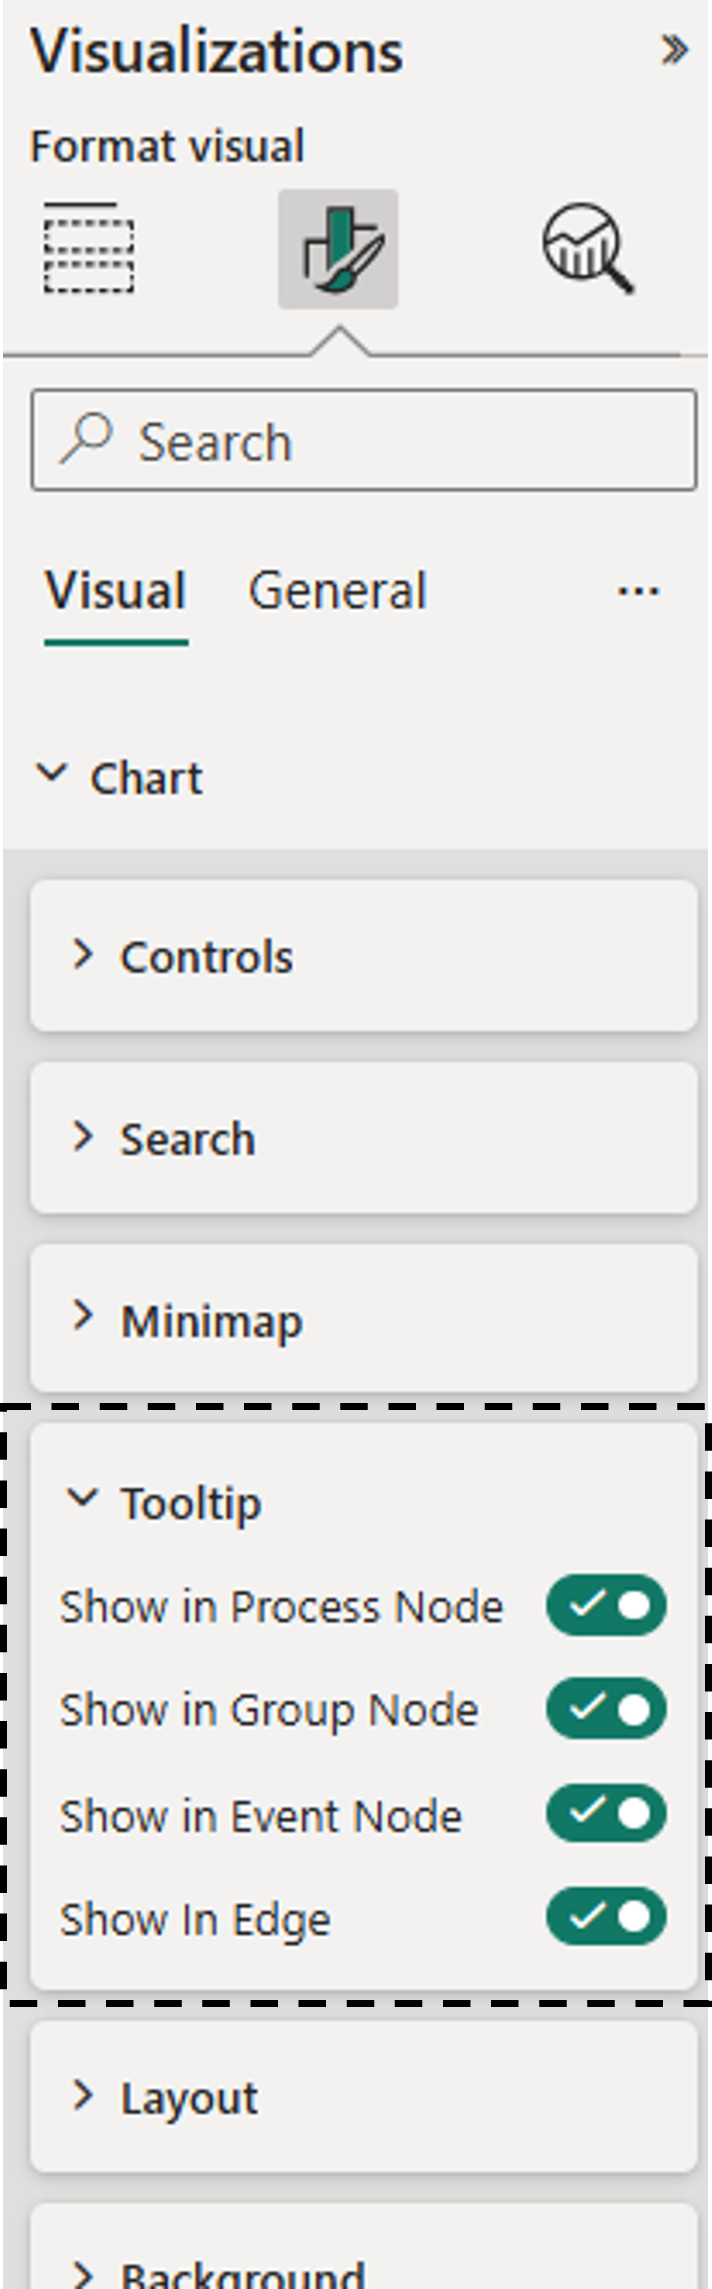
Tooltip
Tooltip can be enabled or disabled from tooltip control button. Disabling the tooltip is useful when presenting and pointout something with mouse without tooltip distraction.
Tooltip levels
Tooltip is shown when hovering: process node, group node, event node or edge.
Depending what is hovered, different level of data is shown. This is important to understand especially when building a 'Custom tooltip'.
- Process node tooltip shows data summarized to Process Id level
- Group node tooltip shows data summarised to Event Id level of all events in group
- Event node tooltip shows data summarised to Event Id level
- Edge tooltip shows data summarixed to Next Event Id level
See Data Summarization to understand data levels.
'Show in" tooltip settings might be helpful if you want to prevent showing tooltip in some specific levels. This usually is the case with custom tooltip.
Custom tooltips migth not work, or can be confusing in some levels. For example if your custom tooltip shows only process level data, it's logical to show it only when hovering a process node.
Default tooltip
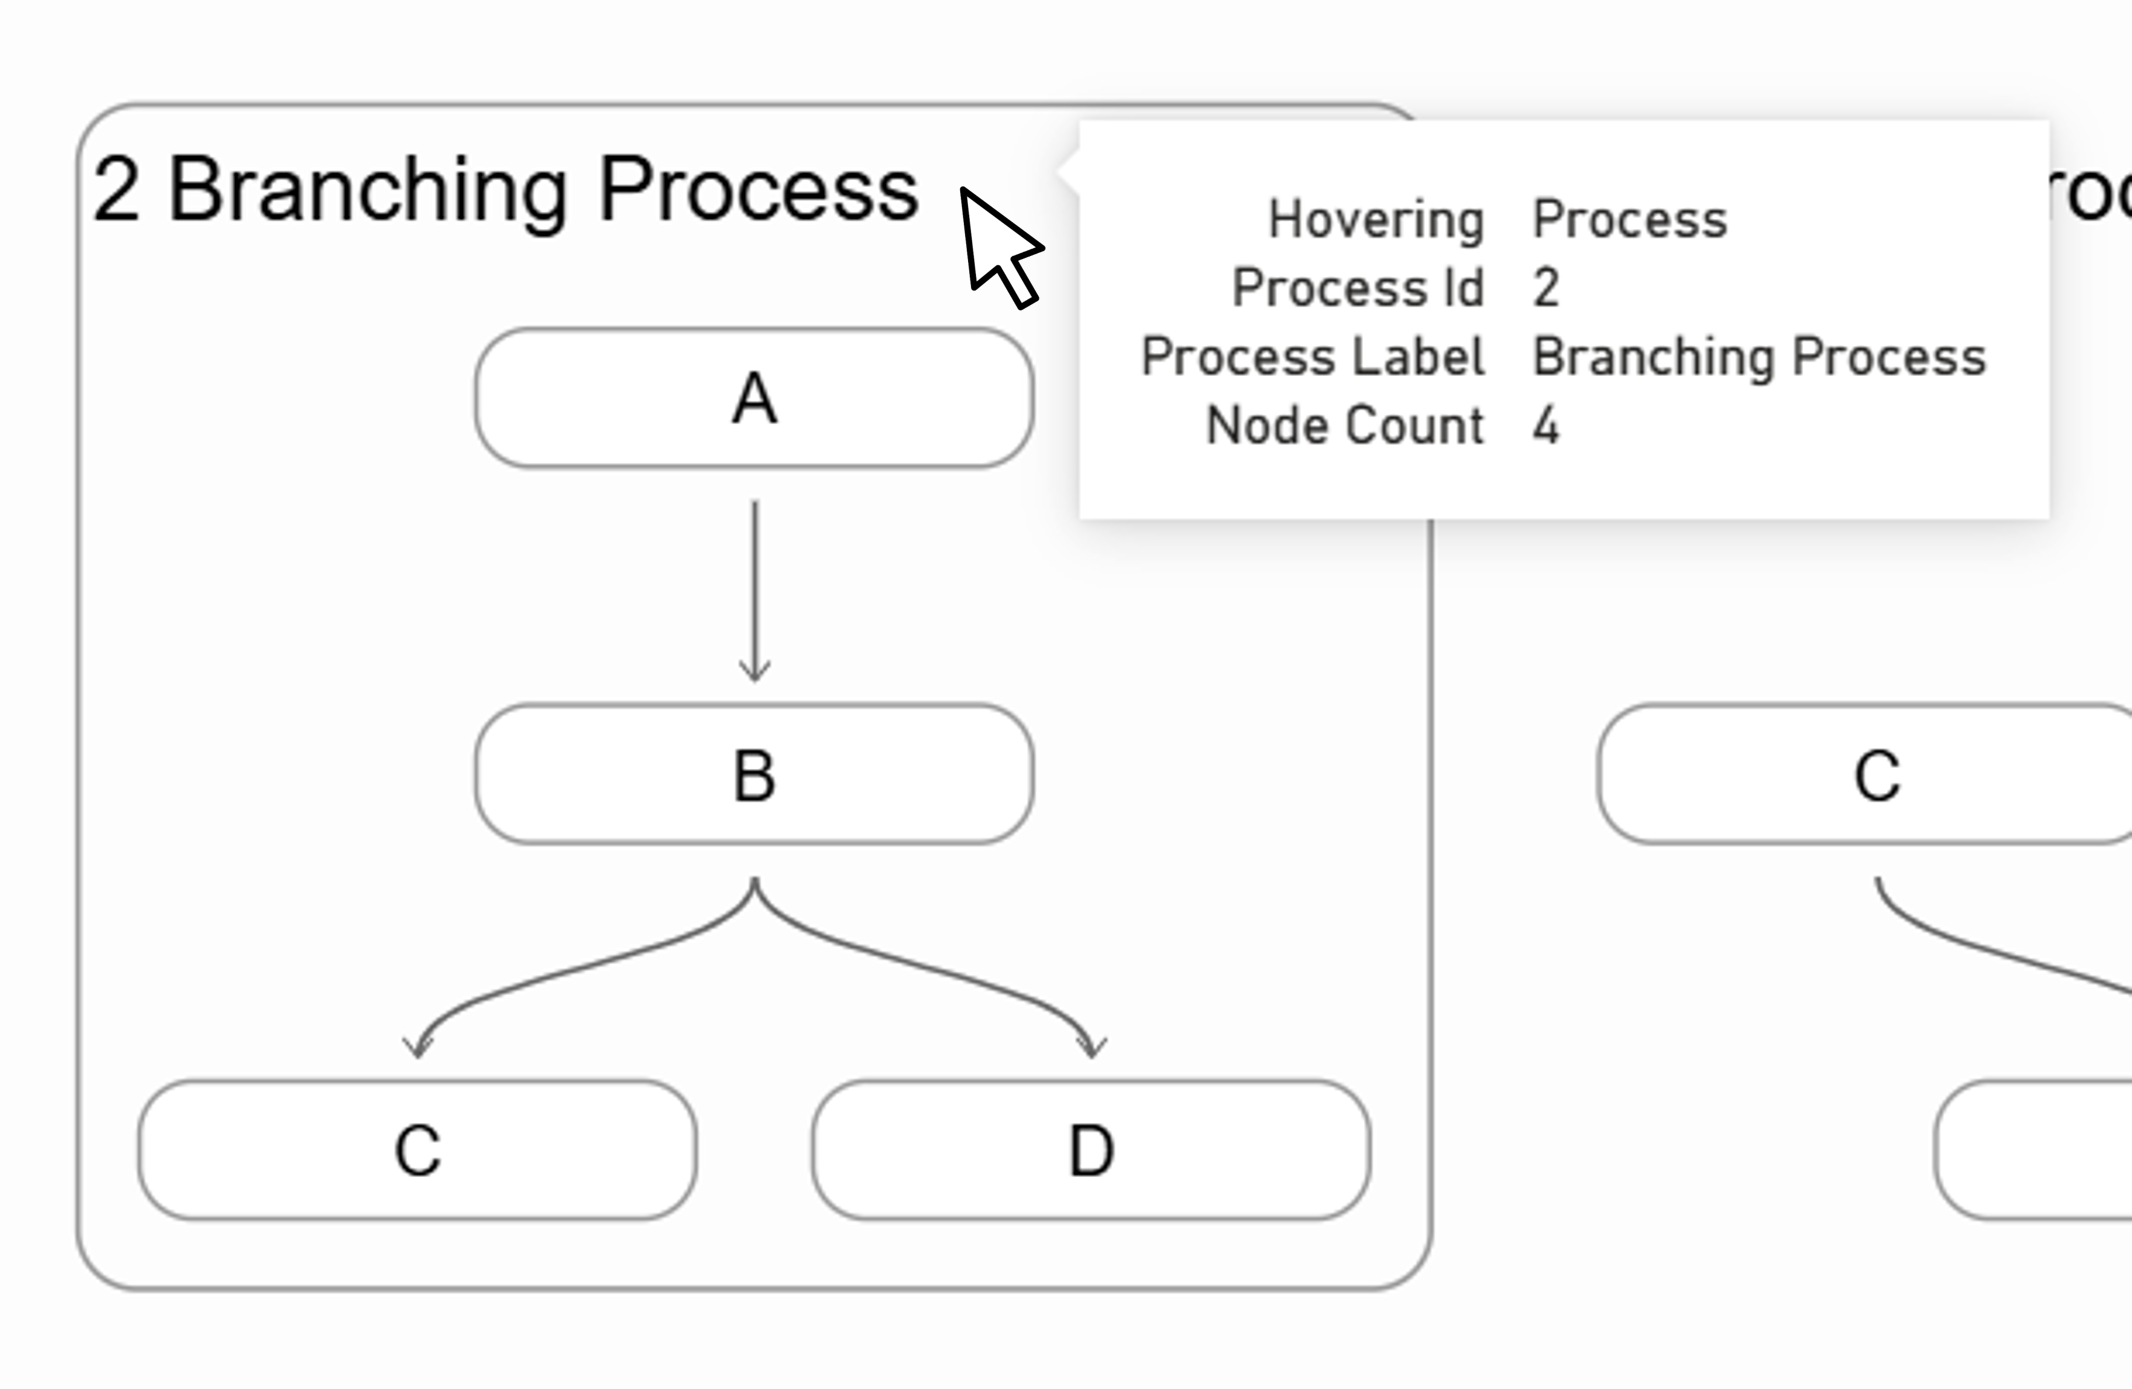
Default tooltip shows data added to the visual and some additional data.
Additional data in default tooltip
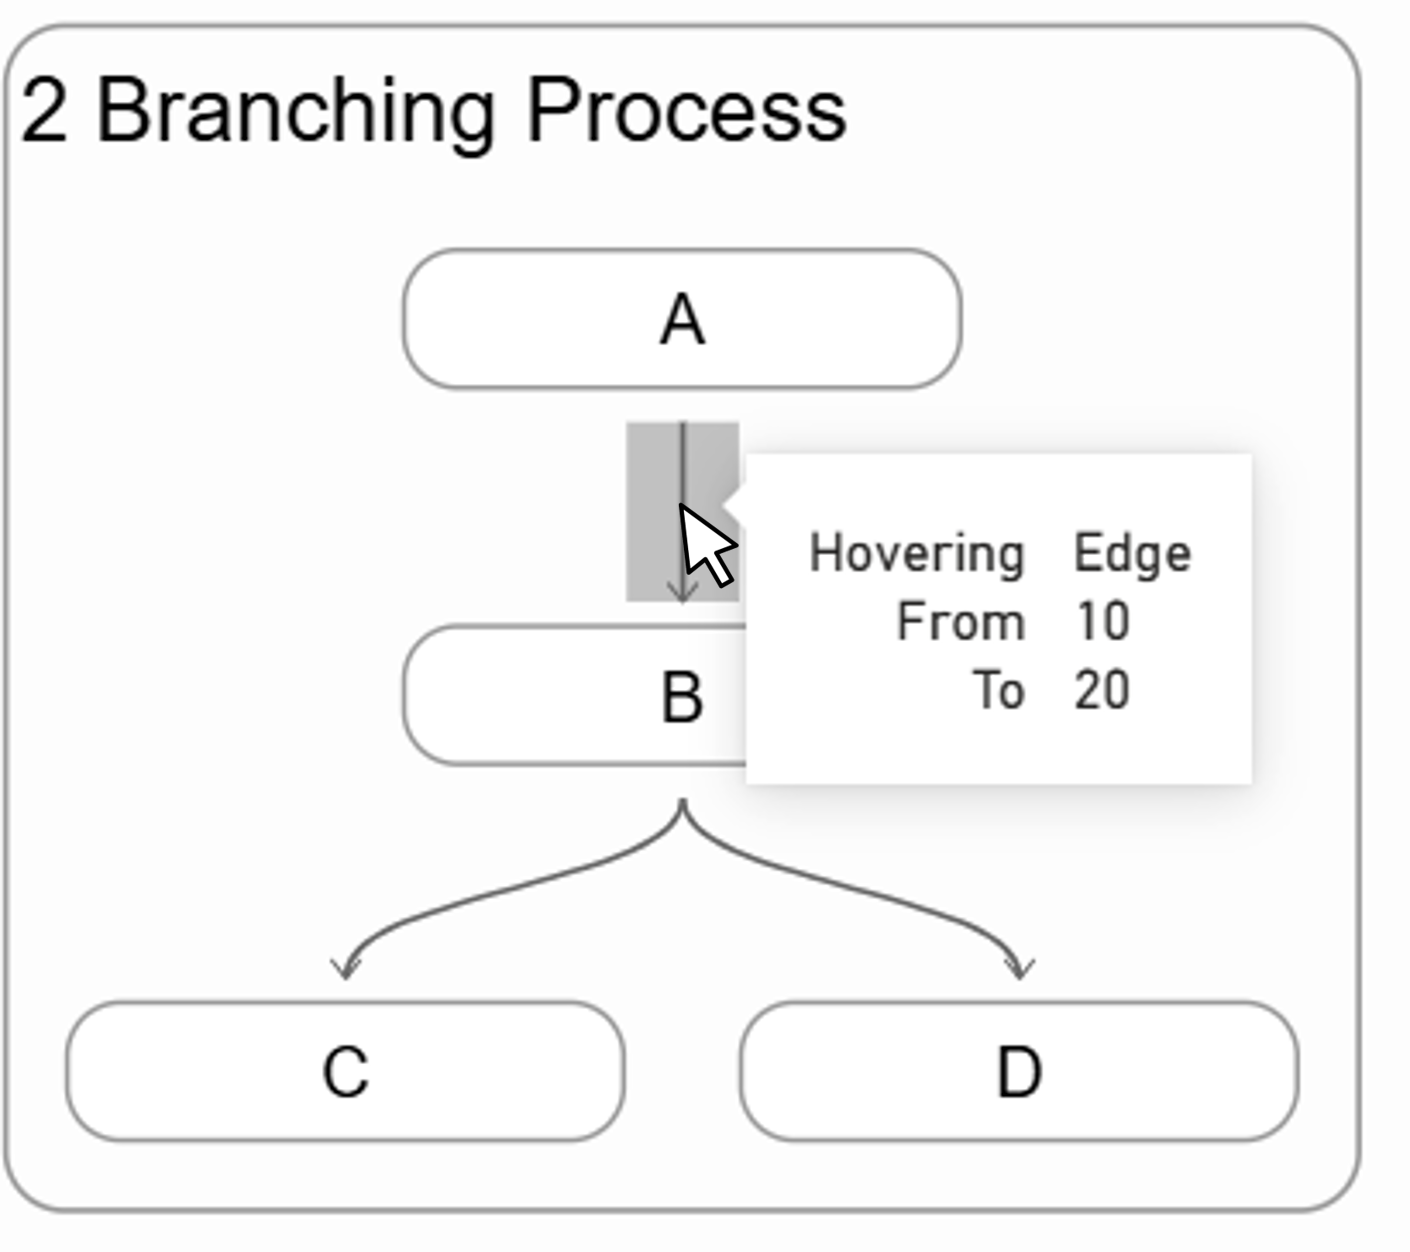
- Tooltip includes label 'Hovering' that indicates what is hovered.
- Tooltip in Process and Group nodes shows 'Node Count' that is count of event nodes in them.
- Tooltip in Edge shows 'From' and 'To' of the Event Id's between egde.
Examples
Custom tooltip
Custom tooltip is made similary as to any Power BI visual. See this official tutorial how: Create report tooltip pages in Power BI - Power BI | Microsoft Learn
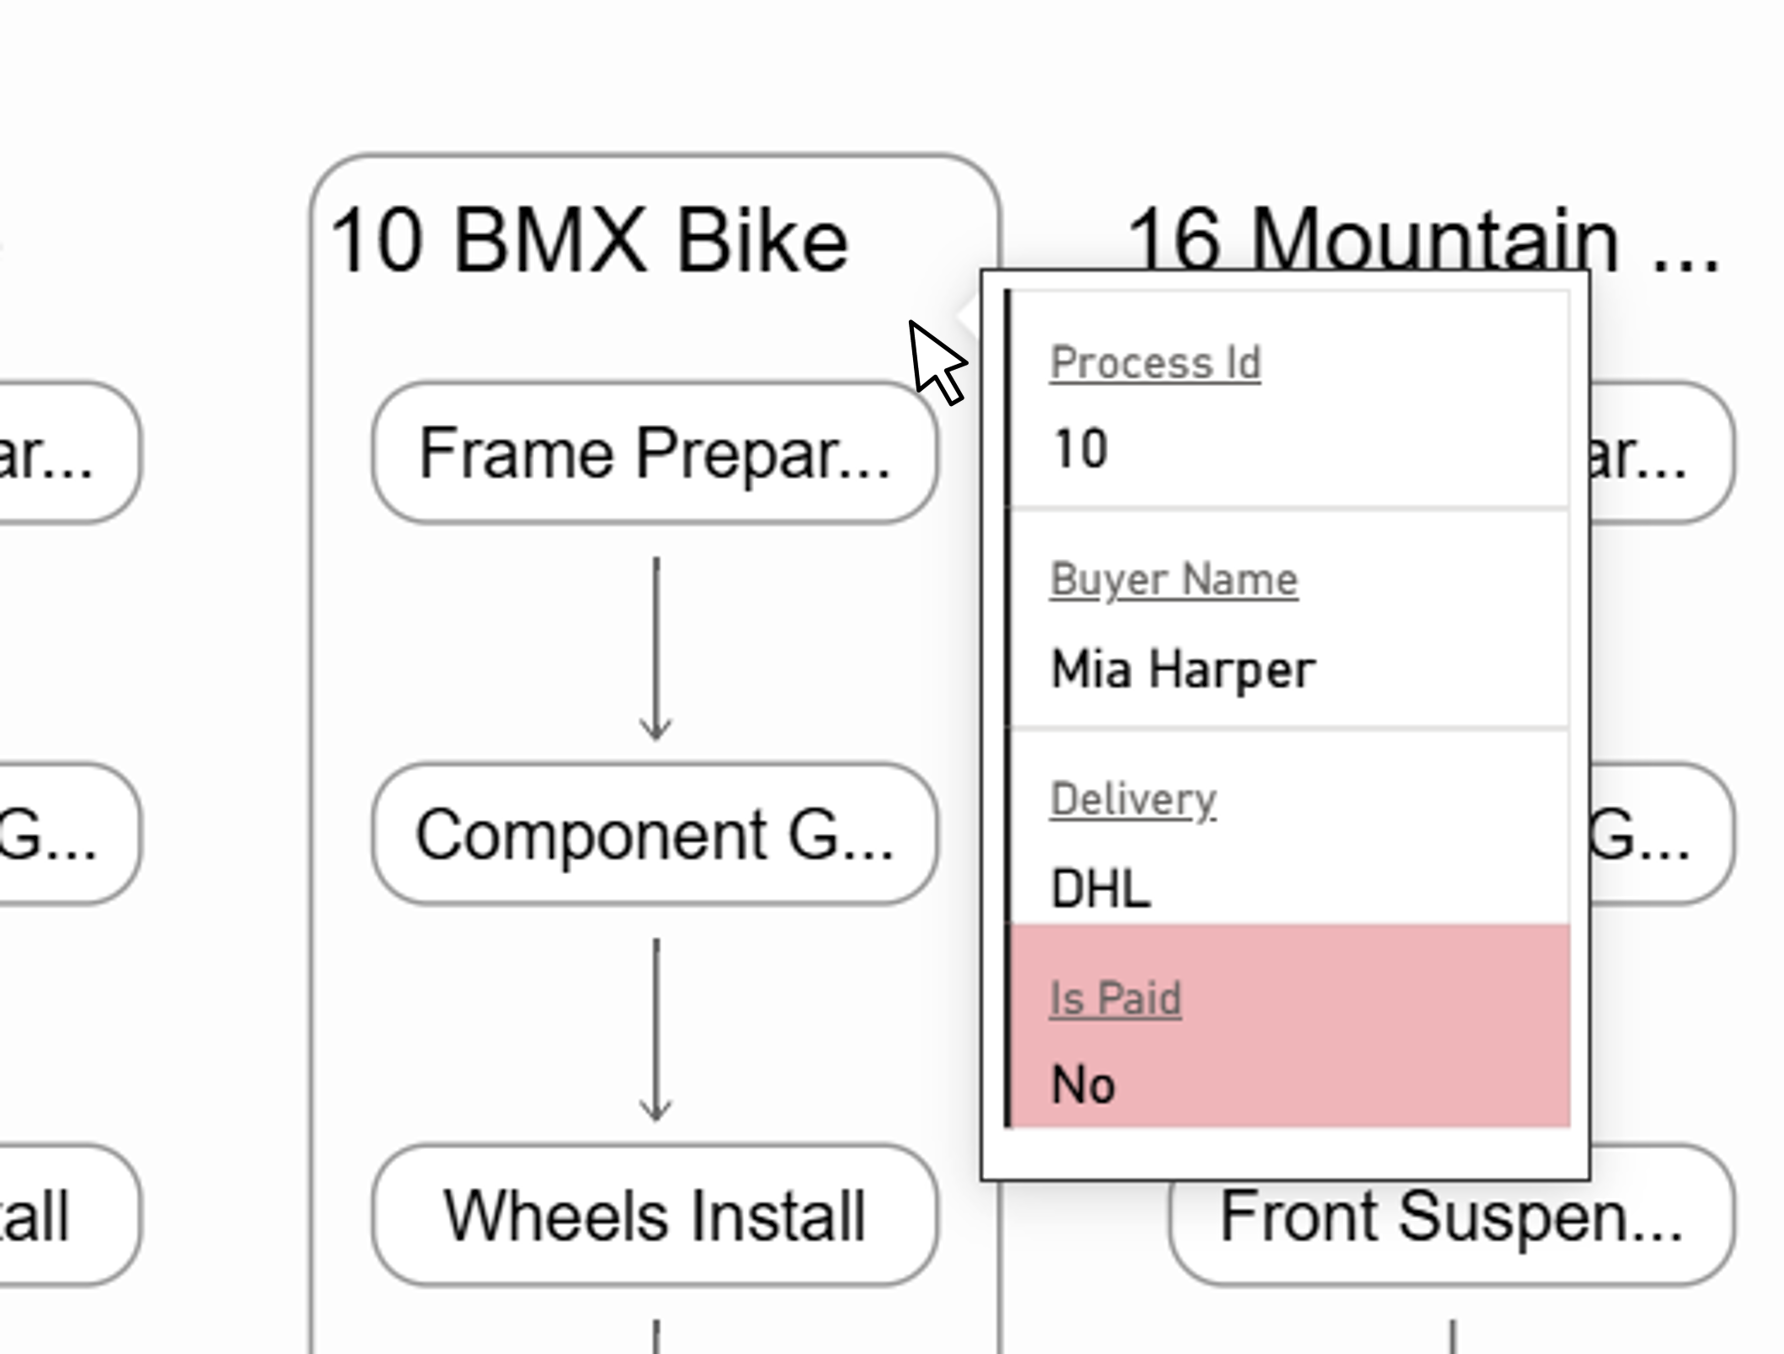
Example
Here's a example of a custom tooltip. It's from our sample report, which can be downloaded from From Visuals Process Chart – Microsoft AppSource . If you want to explore it in more detail, you can find it from the 'Example Manufacturing Process' and 'Manufacturing Process Tooltip' pages of the report.
Tooltip is not supported in the summary view. Only in processes view.